ACR Systems TrendReader Software with USB Interface Cable
- Software for Setup, Configuration and Data Download of Recorded Readings from ACR Data Loggers
- Table or Graphical Format View of Data
- Export Data to Other Programs For Further Analysis in ascii or csv format
- Features Zoom, Add Comments and Printing of Graphs
- Compatible with Windows 10, 8, 7, Vista and XP
Includes USB Interface Cable
Due to Increased Freight Costs, All ACR Systems Orders Must Have a Minimum Order Value of $100

Setting Up The ACR Data Logger
With built-in menus for sample rate and mode, start delay, equations and more, logger setup is fast and easy. In addition, equations are already included for all ACR sensors so you need only select the appropriate equation from the menu or customize your own equation. Real-time readings are displayed in the Setup window, allowing you to verify that your data logger is working correctly before placing it in the field.
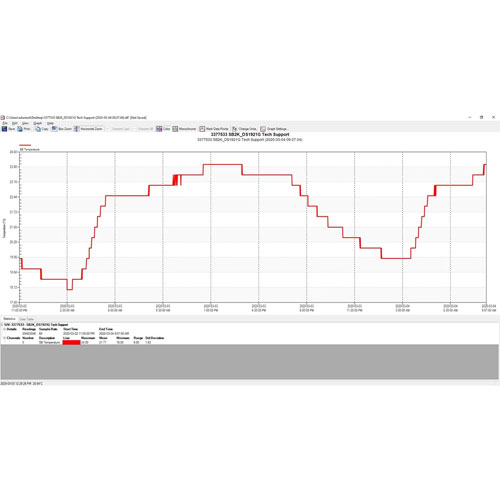
Viewing Data
With TrendReader, data can be viewed in table or graphical format. For presentation purposes, view data in graphical format or for a more detailed analysis, view data in table format. Either way, multiple channel of data can be displayed at once. Multiple graphs can be displayed at once and compounded to create new graphs. For added presentation power, add comments, change graph colours, zoom in on specific portions of data, and display your data using custom engineering units. Print or copy and paste graphs into your reports or presentations. Select all or portions of the table and copy and paste into your favourite Windows program.
Exporting Data
Use the export function in TrendReader to export your data to other programs for further analysis. Data can be exported in ASCII or CSV formats.